The Shooting Star candlestick is a bearish reversal pattern typically seen at the peak of an uptrend. It consists of a single candlestick with a small body positioned at the trading range’s lower end (the body may be green or red) and a long upper shadow extending above the body. This unique formation resembles a shooting star descending from the sky, hence its name.
The extended upper shadow signals the inability of buyers to uphold elevated prices, as sellers assertively intervene to push the price downwards by the session’s conclusion.
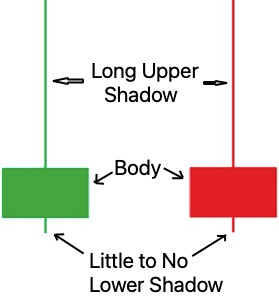
Understanding the Shooting Star Candlestick:
- Small Body: The small body indicates little price movement between the open and close, suggesting indecision or a struggle between buyers and sellers.
- Long Upper Shadow: The extended upper shadow, or “wick,” shows that the price surged significantly during the session but encountered strong selling pressure, resulting in a sharp reversal.
- Short Lower Shadow: In some cases, the Shooting Star may have a short or no lower shadow, indicating the dominance of sellers.
Trading Strategies:
While recognizing the Shooting Star candlestick pattern is crucial, traders should exercise caution and corroborate their analysis with other indicators or factors before making trading decisions. Some strategies include:
- Confirmation: Wait for confirmation through a bearish candlestick or price action supporting the Shooting Star’s reversal signal.
- Support and Resistance: Consider the proximity of key support and resistance levels to assess the strength of the potential reversal.
- Volume Analysis: Analyze the trading volume accompanying the Shooting Star formation to validate its significance.
- Combine this pattern with other technical indicators for added confluence.
- Implement proper risk management techniques to mitigate potential losses (for trading, provide SL).
Example for the Shooting Star Candlestick:

Consider this scenario: the stock is steadily rising, riding an uptrend wave. Just before the shooting star appears, this upward momentum gains pace. Now, picture the shooting star: its opening price shoots upward, reaching higher heights, yet by the closing, it settles near the opening mark. The subsequent day sees a dip in closure, hinting at a potential downward shift. The stock sticks to a downtrend trajectory throughout the following timeframe, with the shooting star’s peak remaining unmatched. For a trader navigating this pattern, it might signal the time to cash in on any long positions once that confirmation candle confirms the move.
Difference Between the Shooting Star and the Inverted Hammer
The inverted hammer and the shooting star may seem to look the same. Both sport lengthy upper shadows and small, real bodies nestled close to the candle’s bottom, with little or no lower shadow. Yet, their disparity lies in the context. A shooting star materializes following a price surge, indicating a probable downturn. Conversely, an inverted hammer emerges after a price slump, suggesting a probable upturn ahead.
FAQs
The reliability of the Shooting Star pattern varies based on factors like market conditions, timeframe, and confirmation signals.
Yes, the pattern can occur on any timeframe, but its significance may differ. Traders should adjust their analysis accordingly.
Yes, variations like the Inverted Hammer and Gravestone Doji share similarities with the Shooting Star but have different formations and implications.
No, A shooting star candlestick with a long upper shadow, hardly any lower shadow, and a small body close to the day’s low is what we call a shooting star. It usually appears after the market has been on an uptrend.


