In this Candlestick Pattern, we’ll show you what this chart looks like, explain its components, teach you how to interpret it with an example, and show you how to trade on the Inverted Hammer Candlestick Pattern.
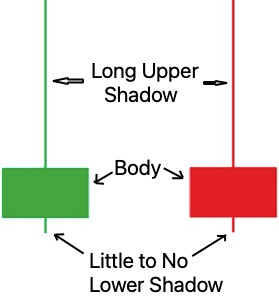
An Inverted Hammer Candlestick features a small body near the top of the trading chart within the range, with a long upper shadow and little to no lower shadow. This formation indicates that buyers attempted to push the price higher but were met with strong selling pressure by the closing of the candle.

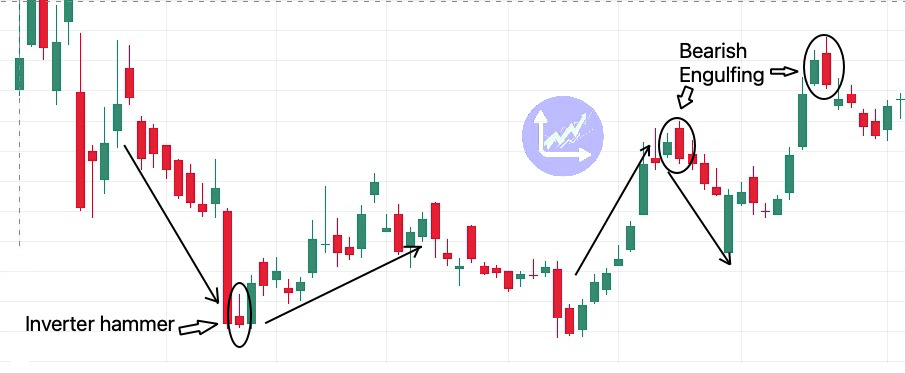
An inverted hammer (I.H.) candlestick pattern is one of the most common and is considered vital for technical analysis. It serves as a warning indicator for a trend reversal. The indicator is mostly used to identify a bullish reversal pattern, indicating a downtrend’s conclusion.
The inverted hammer (I.H.)candlestick configuration, also shown as the Downward hammer (at downtrend ), When the candlestick pattern appears at the end of a downtrend, it suggests that sellers are losing control and buyers may start to dominate. it suggests a possible shift toward bullish sentiment.

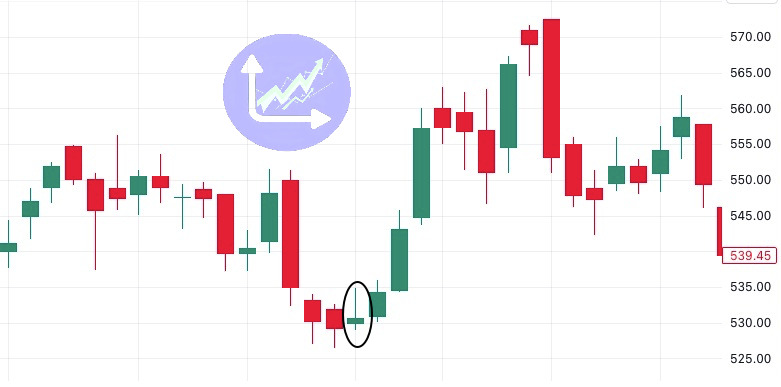
Inverted hammer chart pattern example:
Let’s say you’re following Dabur’s share price, which is on a downtrend, last closing on ₹526.6. The next day, it opens at ₹530, with an intra-day low of ₹529.1 and a high of ₹534.85. Dabur’s share price closes at ₹530.55, creating an inverted hammer pattern, as seen below. Over the next two days, the share price increased to ₹545.45, confirming that this pattern (I.H.) signaled a bullish reversal.

Trading Setup for Inverted Hammer Candlesticks:
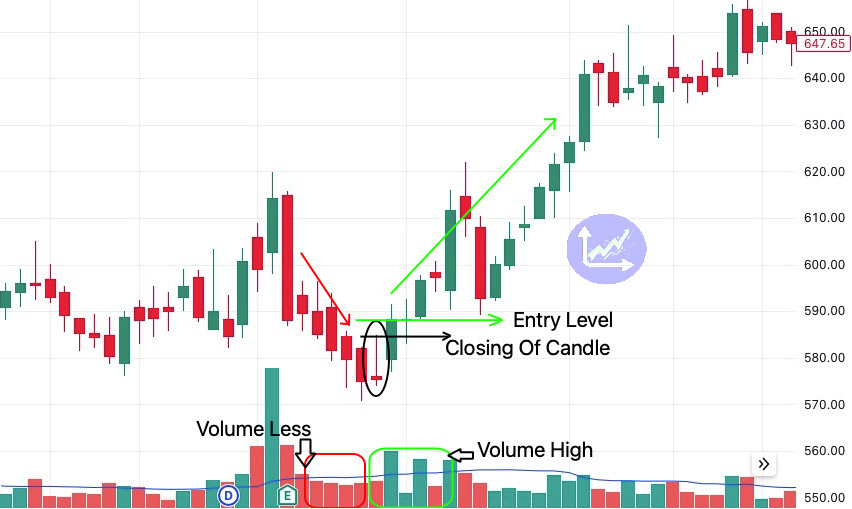
To maximize the effectiveness of I.H. candlesticks in trading, traders should:
- Wait for confirmation before entering a trade.
- The color of the candle is not important.
- The volume is higher on that and the next candle than the previous candle.
- Wait for the closing of the next candle above the inverted hammer candle.
- Set your stop-loss a couple of units below the bottom price of the inverted hammer’s candle.
- Combine this pattern with other technical indicators for added confluence.
- Implement proper risk management techniques to mitigate potential losses (for trading, provide SL).

Benefits of Inverted Hammer Candlestick:
- This Pattern offers versatility across various timeframes and markets, allowing traders to analyze short-term intraday movements as well as longer-term trends.
- Although it is not an absolute predictor of future market trends, it can be a very good indicator of market entry when combined with other patterns.
- This pattern is invaluable for understanding shifts in market sentiment, providing valuable insights to traders regardless of the trading horizon.
Limitations of Inverted Hammer Candlestick:
- Despite its utility, his pattern is not foolproof and may occasionally generate false signals, particularly in volatile or range-bound markets.
- You should only enter a trade if you are confident that the candlestick pattern will materialize.
- Traders are advised to exercise caution and utilize additional confirmation tools to mitigate the risks associated with relying solely on this pattern.
Conclusion
In conclusion, this Candlestick pattern is a powerful tool for identifying potential trend reversals in financial markets. By mastering its interpretation and incorporating it into a comprehensive trading strategy, traders can gain a competitive edge and improve their overall success rate.
FAQs:
Yes, the inverted hammer can be observed on shorter timeframes, but traders should still consider broader market context and volume analysis.
The Shooting Star pattern resembles the Inverted Hammer but signifies bearish reversals instead of bullish ones.
One common mistake is over-reliance on the pattern without considering other factors such as volume and market structure.
Indicators such as volume analysis, moving averages, and trendlines can complement hammer patterns and provide additional confirmation signals.
Also, read All the Single Candlestick Patterns in full detail.


